
Total Environment Butterfly of Dreams Master Plan: How 22.25 Acres at Sarjapur Road Are Laid Out
The Total Environment Butterfly of Dreams master plan places 6 residential towers and 1 commercial tower on 90,059.57 sq m — 22.25 acres — at Thigalachowdenahalli and Dommasandra, Sarjapura Hobli, with 29,140.90 sq m under building, 35,313.68 sq m under landscape, a tertiary nala crossing the site on a 15 m buffer with roughly 220 m of realigned channel, and 6,056 parking bays across three basement levels. From a planning angle, Total Environment Down by the Water keeps the reference local: internal roads, open-space placement, amenity access, and tower orientation all affect how the address will live after handover.
Every figure here comes from the developer's own project data for the scheme marketed as Total Environment Sarjapur Road. No plan has been sanctioned, no Karnataka RERA registration exists as of August 2026, and no Environmental Clearance has been granted. These are filing-grade numbers, not approved ones, and every derived figure shows its arithmetic.
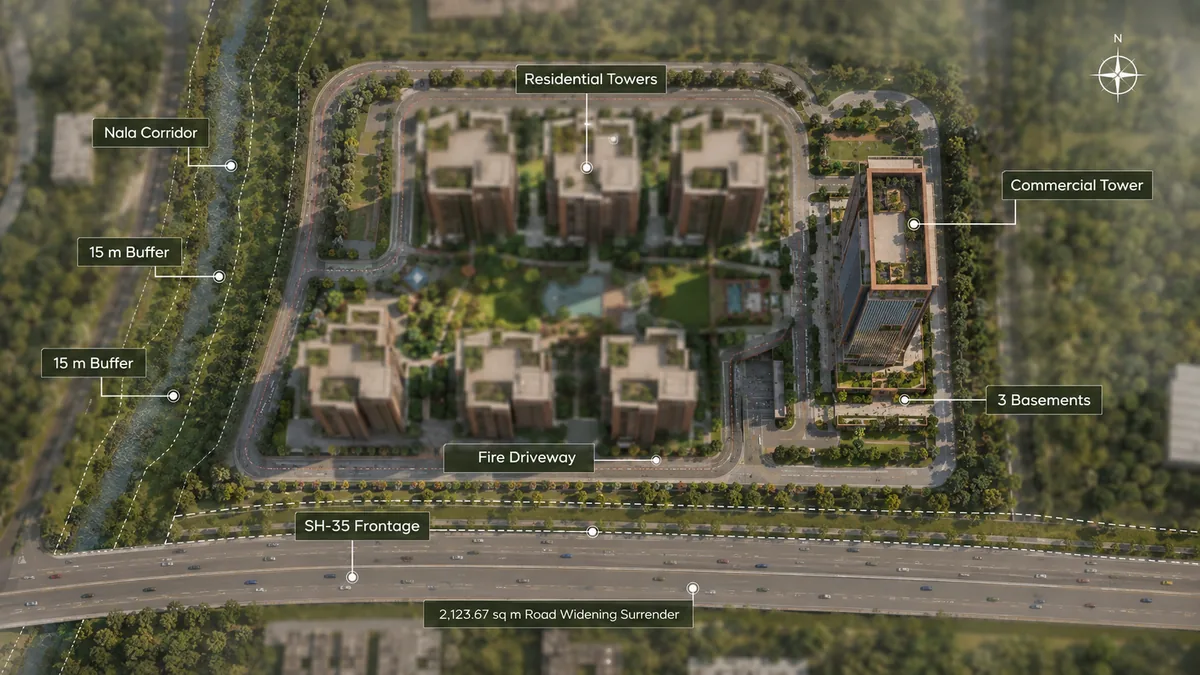
Total Environment Butterfly of Dreams master plan sheet
| Field | Value |
|---|---|
| Gross land / net site | 90,059.57 sq m (22.25 ac) / 87,935.90 sq m (21.73 ac) |
| Ground coverage / landscape | 29,140.90 sq m (7.20 ac) / 35,313.68 sq m (8.73 ac) |
| Total built-up | 680,220.99 sq m · approx. 7.32 million sq ft |
| Towers / apartments | 6 residential + 1 commercial / 1,188 |
| Basements / parking | 3 residential, 4 commercial / 6,056 bays |
| Trees proposed | 800 |
| Approving authority | Bangalore Development Authority — competent authority, not a sanction |
| Launch / completion | Q3 2026 / 28 February 2030 |
The Total Environment Sarjapur Road Master Plan Land-Use Schedule
Two land figures are on record and they are not in conflict — they are gross and net. Gross land is 90,059.57 sq m: at 4,046.86 sq m to the acre, 22.254 acres, reconciling exactly with the revenue description of 22 Acres 10.18 Guntas. Net site is 87,935.90 sq m, or 21.73 acres. The difference of 2,123.67 sq m — 0.52 acres, 2.36% — is the strip surrendered to road widening and civic handover along a state-highway-class frontage. Ratios below use the net site, the land the scheme builds on.
| Land use | Area (sq m) | Area (acres) | Share of net site |
|---|---|---|---|
| Net site | 87,935.90 | 21.73 | 100% |
| Landscape and green | 35,313.68 | 8.73 | 40.16% |
| Ground coverage (buildings) | 29,140.90 | 7.20 | 33.14% |
| Balance — driveway, fire access, service yards, hardscape | 23,481.32 | 5.80 | 26.70% |
The balance line is derived, not stated: 87,935.90 − 29,140.90 − 35,313.68 = 23,481.32 sq m, so the three rows close on the net site with no residual. It carries the fire tender loop, the basement ramps, the drop-offs and the plant yards.
Why "80% open space" is arithmetically impossible here
The green allocation resolves differently by denominator, so both are printed: 40.16% against the net site (35,313.68 ÷ 87,935.90) and 39.21% against gross land (÷ 90,059.57). The commonly quoted "~40%" is the net-site reading, and it is the accurate one.
Several aggregator listings circulate an "80% open space" claim for this project. Take the most generous possible definition — everything on the net site not under a building:
87,935.90 − 29,140.90 = 58,795.00 sq m = 66.86% of the net site.
Even counting every square metre of driveway, ramp, fire path and service yard as open space, the ceiling is 66.9%. Eighty per cent is unreachable by arithmetic, not by opinion. The soft-ground figure buyers mean is the 40.16% landscape allocation.
Reading 33.14% Ground Coverage on a 22-Acre Site
Ground coverage is the honest density number, because unlike unit counts and open-space claims it cannot be redefined. At 29,140.90 sq m the buildings stand on 7.20 acres of the 21.73-acre net site — denser than the low-coverage schemes marketed elsewhere on this corridor, and it should be read as what it is: a mixed-use campus carrying a full commercial tower, not a low-footprint residential estate. Built-up of 680,220.99 sq m against the net site is a ratio of 7.74 — not FAR, since it includes the basements and all non-FAR area, but it fixes the intensity.
Coverage reads differently once unbuildable land is removed. Illustratively, since no site plan is public: the parcel is very nearly square (√90,059.57 = 300.1 m per side); a 16 m peripheral setback leaves an inner rectangle of (300 − 32)² = 71,824 sq m; the nala corridor removes 6,600 sq m more, for a buildable core near 65,224 sq m. Coverage against that core is 44.7% — so the plan puts buildings on a third of the site but close to 45% of the land that can take a building, the more useful figure when judging breathing room between towers. Both the geometry and the setback need confirming at sanction.
Tower Placement Across 22.25 Acres: Six Residential, One Commercial
The tower schedule is the most tightly specified part of the filing, and it closes exactly on the headline count.
| Tower | Configuration | Height | Levels | Apartments | Per floor (derived) |
|---|---|---|---|---|---|
| T1, T2 | 3B + Ground + 36 upper | 112.80 m | 37 | 296 each | 8.22 |
| T3, T4, T5 | 3B + Ground + 36 upper | 112.80 m | 37 | 148 each | 4.11 |
| T6 | 3B + Ground + 37 upper | 115.80 m | 38 | 152 | 4.11 |
| Commercial | 4B + Ground + 34 upper | 147.00 m | 35 | — | — |
| Residential total | 1,188 |
The units add up exactly. (296 × 2) + (148 × 3) + 152 = 1,188. A schedule that closes on its own headline without a residual passes an internal-consistency test many published master plans fail.
The heights confirm a 3.00 m residential floor-to-floor
T6 carries one more upper floor than T1–T5 and stands exactly 3.00 m taller (115.80 − 112.80). That subtraction fixes the floor-to-floor, and both heights then reconcile against an identical residual:
- T1–T5: 37 levels × 3.00 m = 111.00 m, plus 1.80 m of plinth and parapet = 112.80 m
- T6: 38 levels × 3.00 m = 114.00 m, plus the same 1.80 m = 115.80 m
Two independent heights closing on the same 1.80 m allowance is evidence the schedule comes from real drawings rather than marketing.
Two tower types, not six
The per-floor arithmetic separates the six residential towers into two families:
- T3, T4, T5 and T6 are the slim type. 148 homes over 36 floors and 152 over 37 both give 4.11 apartments per floor — effectively four homes per level, the plate that gives every unit two external faces and most of them a corner.
- T1 and T2 are the double type. 296 is precisely 2 × 148, and 8.22 per floor precisely 2 × 4.11 — most economically read as twin-wing structures, two slim plates paired around a shared core, rather than a different building.
That resolves 1,188 apartments into one repeated plate deployed six times in two arrangements, which is why the count divides so cleanly.
The commercial tower is the tallest and the least dense
| Measure | Residential (T1–T5) | Commercial | Difference |
|---|---|---|---|
| Height | 112.80 m | 147.00 m | +34.20 m |
| Upper floors | 36 | 34 | −2 |
| Floor-to-floor | 3.00 m | 4.20 m | +40% |
| Basements | 3 | 4 | +1 |
The commercial tower stands 34.20 m above T1–T5 and 31.20 m above T6 while carrying two fewer upper floors. The reason is floor-to-floor: 147.00 ÷ 35 levels = 4.20 m exactly, against 3.00 m residential — the Grade-A office signature, and what a raised access floor, a services plenum and a 2.7–3.0 m clear ceiling cost in vertical space. Its fourth basement matters too: a separate parking stack is the only practical way to keep office visitors out of a basement shared by 1,188 homes.
Where the towers sit is not public. No site plan has been released and none should be inferred from a render. The constraints say only that a 147 m office tower needs arterial frontage and an independent arrival point, that the nala corridor cannot carry a building, and that the residential towers therefore take the deeper part of the parcel.
For a same-locality comparison, Nambiar District 25 sits roughly 1.56 km away at Dommasandra and is the nearest comparable Grade-A master plan.
The Tertiary Nala: A Real Design Constraint, Not a Boundary Detail
Most Bengaluru schemes that mention a nala have one along an edge. This one has a tertiary nala running through the site, with a 15 m buffer and approximately 220 m of channel realignment in the project data — the most consequential line on the master plan.
The reserved corridor. A 15 m buffer either side of the channel gives a 30 m reserved width. Over the 220 m realigned run:
220 m × 30 m = 6,600 sq m = 1.63 acres = 7.33% of the gross parcel
Measured from each edge of a 3–4 m channel rather than the centre line, the corridor widens to roughly 34 m and the reservation rises to about 7,480 sq m (1.85 acres). Karnataka's buffer regime has been read both ways, so both are printed and the sanctioned plan governs. The difference is roughly 880 sq m — a fifth of an acre — either buildable or not.
What it costs, and what it returns. A 6,600 sq m corridor is 18.7% of the 35,313.68 sq m landscape allocation — so the buffer is not lost land, provided it is designed as landscape. A 220 m water corridor on a nominally 300 m square parcel crosses roughly three-quarters of the site's width, making it the natural spine for the walking network rather than a fenced strip.
The realignment is the risk. Moving 220 m of a natural drain is a regulated act, not a landscaping decision: it needs the drain-controlling authority's consent, must carry the upstream catchment's design storm flow, and is a standard Environmental Clearance condition at this scale. Since no EC application for this project appears on the public portal as of August 2026, it has not been through that scrutiny — so the alignment can still move between filing and sanction, taking whatever is planned beside it, and the infiltration case the corridor and 22 recharge pits make together is only as good as the channel's maintained condition after handover.
Landscape, Open Space and the 800-Tree Programme
The 35,313.68 sq m landscape allocation is 8.73 acres, carrying 800 new trees.
| Ratio | Working | Result |
|---|---|---|
| Landscape per apartment | 35,313.68 ÷ 1,188 | 29.7 sq m (about 320 sq ft) |
| Trees per gross acre | 800 ÷ 22.25 | 36.0 |
| Trees per landscaped acre | 800 ÷ 8.73 | 91.7 |
| Landscape per tree | 35,313.68 ÷ 800 | 44.1 sq m |
Against the gross site, 36 trees per acre is moderate — lighter than the 70–80 some large Bengaluru schemes commit to. Against the land actually planted, 92 per landscaped acre puts a tree roughly every 6.6 m on a square grid: genuine canopy spacing, not ornamental scatter.
The species schedule is not in the project data, and that is the gap worth pressing on — twenty-year canopy performance is decided by the palette, not the count. Ask for the species list and a written three-to-five-year maintenance obligation in the association handover. Note too that landscape appears as a single allocation rather than splitting out a statutory park reservation; if one is carved out at sanction, usable resident landscape falls.
Roads, Circulation and the 26.70% Balance
The site takes access from the Sarjapura–Ambalipura Main Road / SH-35 corridor. The project data records the corridor at 0.1 km, but that is a boundary measurement, not a travel distance. By road the nearest arterial node is Muthanallur Cross at 1.37 km; Dommasandra Junction, the westbound gateway, is 2.1 km.
The 23,481.32 sq m (5.80 acres, 26.70% of net site) balance allocation absorbs everything that moves.
- The high-rise fire loop. All seven towers stand well above the 45 m threshold at which continuous, load-bearing fire-tender hardstanding with turning room at every entrance becomes mandatory. A perimeter-and-spur loop of 1,200 m at 6 m wide takes roughly 7,200 sq m — a third of the balance allocation before a car has moved.
- Basement ramps. At a 1:8 gradient and 3.2 m between slabs, each level needs a 25.6 m run; three levels is a 76.8 m ramp line, and at 7 m for two-way movement about 538 sq m per stack. Three or four stacks — residential in and out, commercial, service — is on the order of 2,150 sq m given to ramps alone.
- Segregated commercial access. A 147 m office tower generates a sharply peaked twice-daily traffic profile that must not cross resident circulation; its own basement stack and arrival point make that separation possible.
- Service and refuse routes to 7.63 MT/day of waste handling, plus drop-off and visitor circulation.
The compensating move is that parking is entirely below grade: a resident arriving by car goes basement to lobby to home without crossing the fire driveway, decoupling pedestrian from vehicle movement and making the 8.73 acres of landscape usable rather than ornamental.
Three Basements and 6,056 Parking Bays
6,056 bays across three basement levels — four beneath the commercial tower. The number only makes sense once you stop reading it as residential: 6,056 ÷ 1,188 apartments = 5.10 bays per home, and no Bengaluru residential scheme is planned at five bays per apartment. The bulk serves the office tower.
The basement footprint follows. At a gross 32.5 sq m per bay including aisles, ramps, plant rooms and structure:
6,056 × 32.5 = 196,820 sq m of basement
Over three levels that is 65,607 sq m per level, 72.8% of the gross parcel; weighted for the commercial tower's fourth level, roughly 61,500 sq m or 68.3%. Either way the basements run far beyond the tower footprints and sit under most of the site — which is why the recharge pits and drainage design matter.
Subtracting that estimate from the 680,220.99 sq m total leaves roughly 483,400 sq m above ground, about 5.2 million sq ft. For scale, Total Environment states 6 million sq ft delivered to 1,600-plus customers since 1996: this single project's approximately 7.32 million sq ft exceeds the developer's whole delivered portfolio to date. That is a comparison, not a criticism — but on a builder with a documented multi-forum record of possession delay, one 22-acre campus against thirty years of cumulative delivery is a number a buyer should weigh. For how the developer handles a large parcel elsewhere in the city, Down by the Water at Jakkur is the nearest comparison.
Below-ground infrastructure
The basements carry more than cars: water storage including the 1,020 cu m rainwater sump plus fire reserve; domestic, hydro-pneumatic, fire and irrigation pump rooms; transformer, HT and DG rooms with their exhaust and fuel provisions; service cores rising into all seven towers; waste segregation rooms feeding the 7.63 MT/day stream; and smoke extraction across roughly 197,000 sq m of enclosed parking. Generic templates quote two basements at this scale; this plan is 3B + G + 36 or 37 residential, 4B + G + 34 commercial.
Sustainability Infrastructure, in Numbers
| System | Provision |
|---|---|
| Water demand | 2,202 KLD |
| Wastewater generated | 1,982 KLD |
| Sewage treatment | 2,020 KLD, Sequencing Batch Reactor (SBR) |
| Rainwater sump | 1,020 cu m |
| Groundwater recharge | 22 recharge pits |
| Solid waste | 7.63 MT/day (7,630 kg/day) |
The STP headroom is thin. Installed capacity of 2,020 KLD against 1,982 KLD generated is a margin of 38 KLD — 1.92%, close to zero redundancy: a single-train plant taken offline for servicing has nowhere to send the flow. SBR technology handles a residential diurnal load well, but whether the 2,020 KLD is one train or several modules is the question to ask — modularity, not headline capacity, is what protects a campus this size during maintenance.
Wastewater return runs at 90.0% (1,982 ÷ 2,202), the high end of the 80–90% band normally applied — little is written off to irrigation and evaporation, which makes the treated-water loop back into flushing and landscape load-bearing, not decorative.
Rainwater capture is modest against demand, meaningful against roof yield. The 1,020 cu m sump is 0.46 days of the 2,202 KLD demand. Against catchment it reads better: 970 mm of annual Bengaluru rainfall at a 0.8 runoff coefficient yields between 10,300 cu m (on an estimated 13,250 sq m of tower roof) and 22,600 cu m (the full 29,140.90 sq m coverage as upper bound). The sump is 4.5% to 9.9% of annual yield, so it must fill and draw down ten to twenty times a season — making drawdown discipline as important as tank size.
Recharge density is sound. Twenty-two pits across 35,313.68 sq m of landscape is one per 1,605 sq m of soft ground, just under one per gross acre. This parcel sits outside the Cauvery service area and depends on borewell, tanker and in-project treatment, so recharge is part of the water balance.
Three numbers that only make sense campus-wide
Parking, water and waste were each tested against 1,188 apartments alone. All three fail the same way, by the same margin.
| Load | Campus total | Per apartment if residential-only | Residential norm | Implied non-residential share |
|---|---|---|---|---|
| Parking | 6,056 bays | 5.10 bays | 1.5 – 2.0 bays | 61% – 71% |
| Water | 2,202 KLD | 1,854 litres/day | 600 – 750 litres/day | 60% – 67% |
| Solid waste | 7,630 kg/day | 6.42 kg/day | 2.0 – 2.5 kg/day | 61% – 69% |
Three independent metrics converging on roughly 60–70% non-residential load is not coincidence — it is the commercial tower showing up in the plant sizing. The consequence is maintenance-charge apportionment: if the STP, the water plant, the waste handling and the substation are sized 60–70% for an office tower, the cost-sharing formula between the residential association and the commercial owner is a material term, not a footnote. Ask for it in writing.
What to Verify Before You Commit
This is a pre-launch scheme, and the master plan above comes from the developer's project data, not an approved drawing.
- Ground coverage and landscape — confirm 29,140.90 sq m and 35,313.68 sq m survive into the sanctioned plan. Coverage is the number the density case rests on.
- The nala — the realigned alignment, the buffer measured from centre line or edge, and the drain authority's written consent.
- RERA — there is no Karnataka RERA registration for this project as of August 2026, and none has been applied for. Under section 3 of the RERA Act 2016, marketing and sale are unlawful until registration is granted. Verify at rera.karnataka.gov.in.
- Environmental Clearance — 680,220.99 sq m of built-up requires SEIAA Karnataka clearance. No application appears on the public portal, and the buffer conditions get set there.
- Approving authority — the Bangalore Development Authority is the competent planning authority for both parcel villages. That is not a statement that any plan has been sanctioned.
- Configuration sizes — the statutory documents do not state the BHK mix. A 3 BHK band of roughly 2,400–3,500 sq ft is corroborated by third-party marketing at 2,430–3,240 sq ft; any larger 4 BHK band is unsupported. Every size is predicted.
- The plant and the split — whether the 2,020 KLD STP is modular, and the cost-sharing formula behind the 60–70% non-residential load.
Nothing here is an approval, a price or a commitment — it is the land-use arithmetic of a filing, published so it can be checked against the sanctioned plan when one exists.
Contact the Total Environment Butterfly of Dreams desk
Ask for the brochure, the cost sheet when it is issued, floor plates and a site visit for Total Environment Butterfly of Dreams.
Total Environment Butterfly of Dreams master plan — questions
What water and sewage infrastructure is planned, and where does the water come from?
The developer's project data records water demand of 2,202 KLD, wastewater of 1,982 KLD, a 2,020 KLD sequencing-batch-reactor STP, a 1,020 cu m rainwater sump, 22 recharge pits and 7.63 MT/day of solid waste. Three sums matter: installed STP capacity sits 1.9% above generation, almost no margin; at 1,982 against 2,202 KLD, 90% of every litre drawn returns as sewage, making the plant rather than the borewell the operating constraint; and 1,020 cu m against 2,202 KLD is about eleven hours of supply. The site is in Anekal Taluk, outside the Cauvery Stage V service area, so there is no confirmed BWSSB connection — expect borewell, tanker, the in-project STP and recharge, and treat this as the material infrastructure risk here.
Which amenities are actually confirmed?
Only what appears in the filing: landscaped open area, civic amenity provision, internal driveways and fire-tender access, the 2,020 KLD SBR sewage treatment plant, DG backup and transformers, 22 recharge pits, the 1,020 cu m sump, 6,056 bays and 800 proposed trees. A clubhouse, pool, gymnasium, sports courts, co-working and spa all appear in third-party listings and none appears in the statutory documents. That does not mean they will be absent — it means nobody has committed to them in a document you could hold them to.
How many towers, floors and apartments will there be?
Seven towers over three basements. T1 and T2 are 3B+G+36UF at 112.80 m with 296 apartments each; T3, T4 and T5 are the same height with 148 each; T6 is 3B+G+37UF at 115.80 m with 152. The commercial tower is 4B+G+34UF at 147 m. The arithmetic closes exactly — (2 × 296) + (3 × 148) + 152 = 1,188, no residual — which is why the unit counts circulating on aggregator pages, none of which sum to the filed total, read as marketing.
When will it launch, and when is possession?
Launch is stated as Q3 2026 and completion as 28 February 2030. Neither binds anyone, because a possession date becomes enforceable only once entered on a RERA registration, and none exists. With nothing filed with the regulator and no environmental clearance application on record as of mid-August 2026, a Q3 2026 launch would require both to move quickly. Read 28 February 2030 as a planning assumption, not a commitment.
How tall are the towers, and how many homes are on each floor?
The five shorter residential towers stand 112.80 m over 37 habitable levels — 3.05 m floor to floor — and T6 stands 115.80 m over 38, exactly one 3.00 m floor taller. Dividing units by levels gives the plate: eight homes per floor on T1 and T2, four per floor on T3 through T6. A four-per-floor plate at 37 storeys is a slim tower with exposure on more than one face; eight per floor is a conventional double-loaded corridor. The commercial tower's 147 m across 35 levels is 4.2 m per level — office-grade.
What configurations and unit sizes will be offered?
The BHK mix is not officially stated anywhere. The statutory documents give the unit count and tower geometry, not the split by bedroom count or any unit size. What exists is a client prediction and an independent third-party quotation for this project, and they only partly agree. Treat the 3 BHK band as reliable. The 4,500–6,000 sq ft 4 BHK is the weakest input in any model here and inflates the top of the price stack by several crore on no evidence.